Data integration
Modular situation assessment
The marketplace provides data sources and tools to merge them according to analysis needs and display them in processed form in dashboards. The marketplace is created jointly during the agile development phase according to the analysis objectives and the users. Activation in DSaS takes place in a drag & drop interface.
The DSAS platform is designed according to open architectures and NATO standards (NAF, NISP, JC3IEDM, NGVA, NCISS-A), allowing it to run with the highest information security (Zero Trust approach) on any cloud, on-premise, and in the field. This platform architecture enables the integration of additional data sources from the public domain, industry, or the own defense sector.

Drag & Drop Interface
Active tools and data
Data orchestration
Role-specific situation assessment
In DSaS, missions can be planned, simulated, and evaluated for the command and reconnaissance domains.
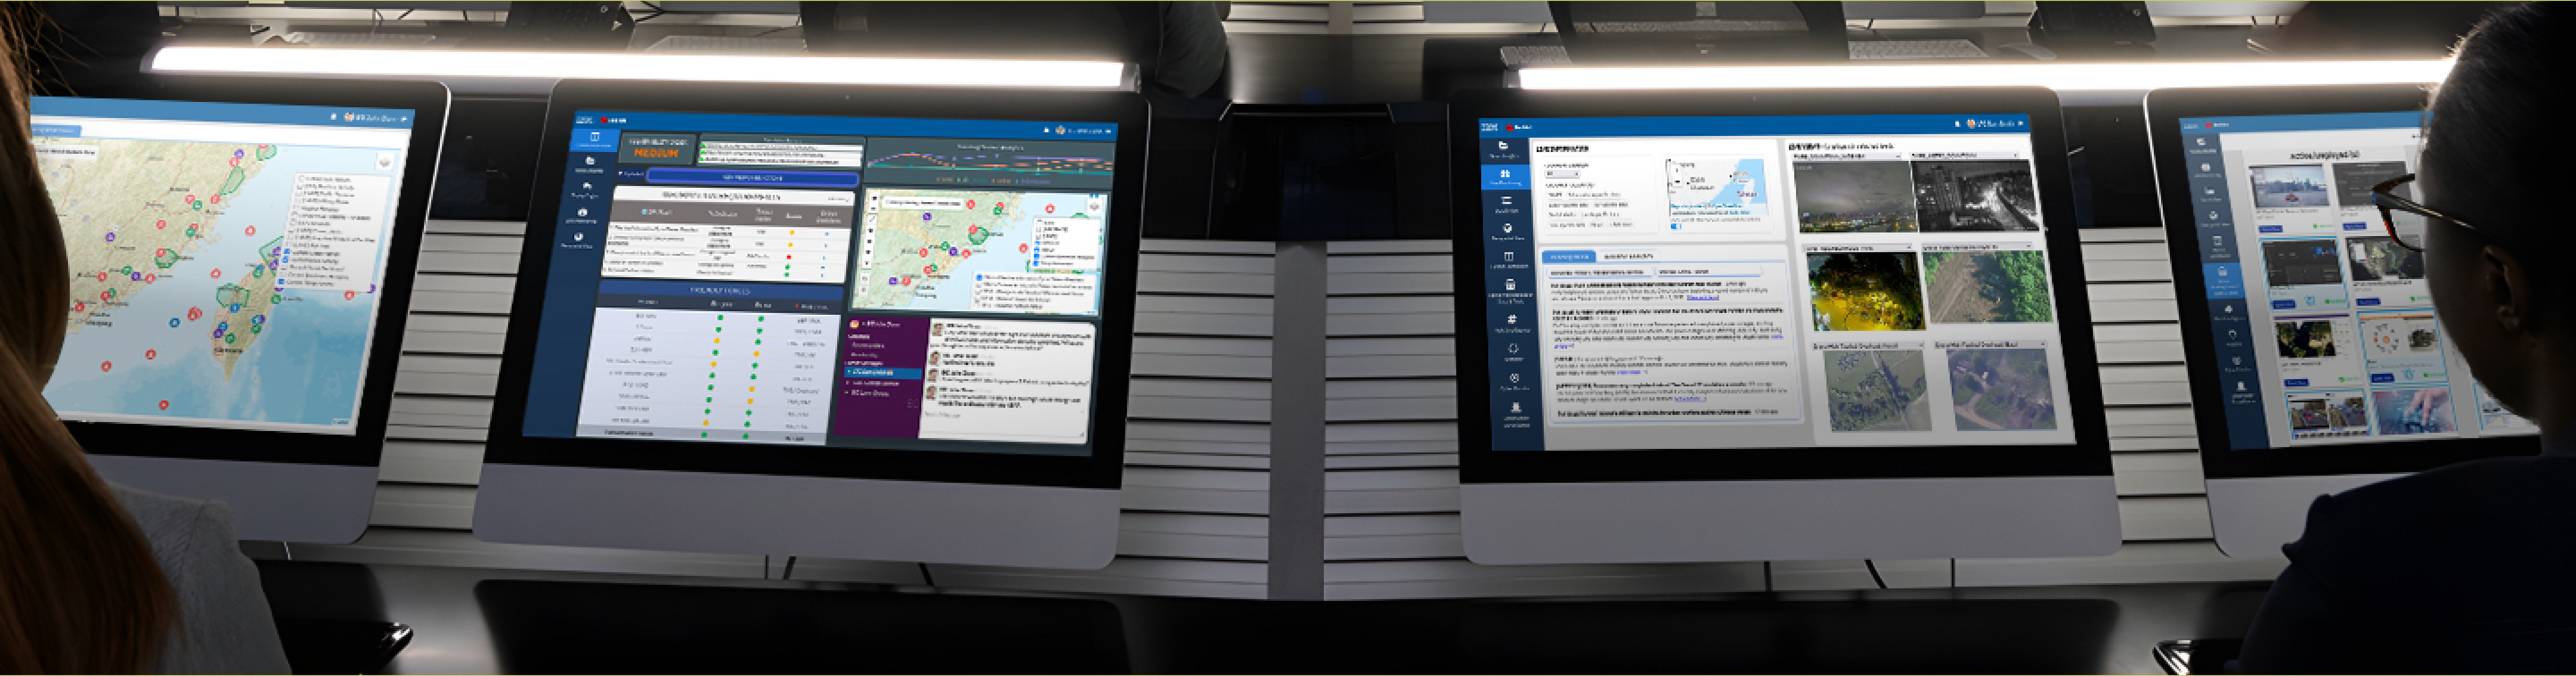
Dashboards with individual thematic focus can be selected, or various data sources and tools can be combined in a hybrid dashboard. The configuration is adapted to specific roles such as commanders, analysts, or operators and can be personalized.
The Commander View e. g. is designed to prepare decisions and assess them data-driven. The pre-prioritized decision points are classified based on the set parameters and can be played through. The AI-supported simulation provides evaluated action options, whose assessment can be checked and evaluated. Human feedback refines and calibrates the AI services.

Trending domain activity
Pre-prioritized listing of decision points
Communication in dashboard
Speed
Faster situation assessment
DSaS brings together various data sources from all domains while adhering to all necessary security standards. The military sector is specifically supplemented with data from the public information space, such as news, social media, or weather data. For example, the News Insights Dashboard offers a targeted search and evaluation of context-specific news.
Using AI algorithms and customized search parameters, the large amounts of data are filtered and organized. In the dashboard, they are also linked with spatial and temporal locations.
Likewise, the relationships between people and organizations in these news items can be visualized, for axample, in a network map.

Timeline for identifying hotspots
Geographical classification of news
Real-time data
Timely situation assessment
In the Live Monitoring dashboard, live data can be combined, for example, from cameras or news. The selection of live feeds is also AI-supported.
The live feed selection can be combined with current news. Data sources can be freely combined for each mission, and specific domain interests can be selected. The news can be filtered by keyword input. The displayed news can be quickly classified with domain markings and timestamps.
The inclusion of such real-time data in a platform simplifies access and extends the analysis with important components for a better understanding of the situation.

AI-supported selection of live feeds
Combination with selected news feeds
Linking domains
Connected situation assessment
The Physical Domain dashboard vividly shows the linking of data from which information for a better situation assessment is created. The overview locates the information geospatially and allows capturing the observed space from a multi-domain perspective.
The information is processed and can be individually connected. Due to the already mentioned integration of live data sources, which also includes Web Intelligence, a networked overview of developments in the domains and their interplay is created.

Domains and data sources selectable
Setting of assumptions


